The Story So Far
As promised in the previous post, I'm going to give some details of what was achieved in terms of the development of the prediction system last year. The detail level here won't be too painful, but hopefully it will give you a taster of what the system is currently comprised of.
High Level Overview
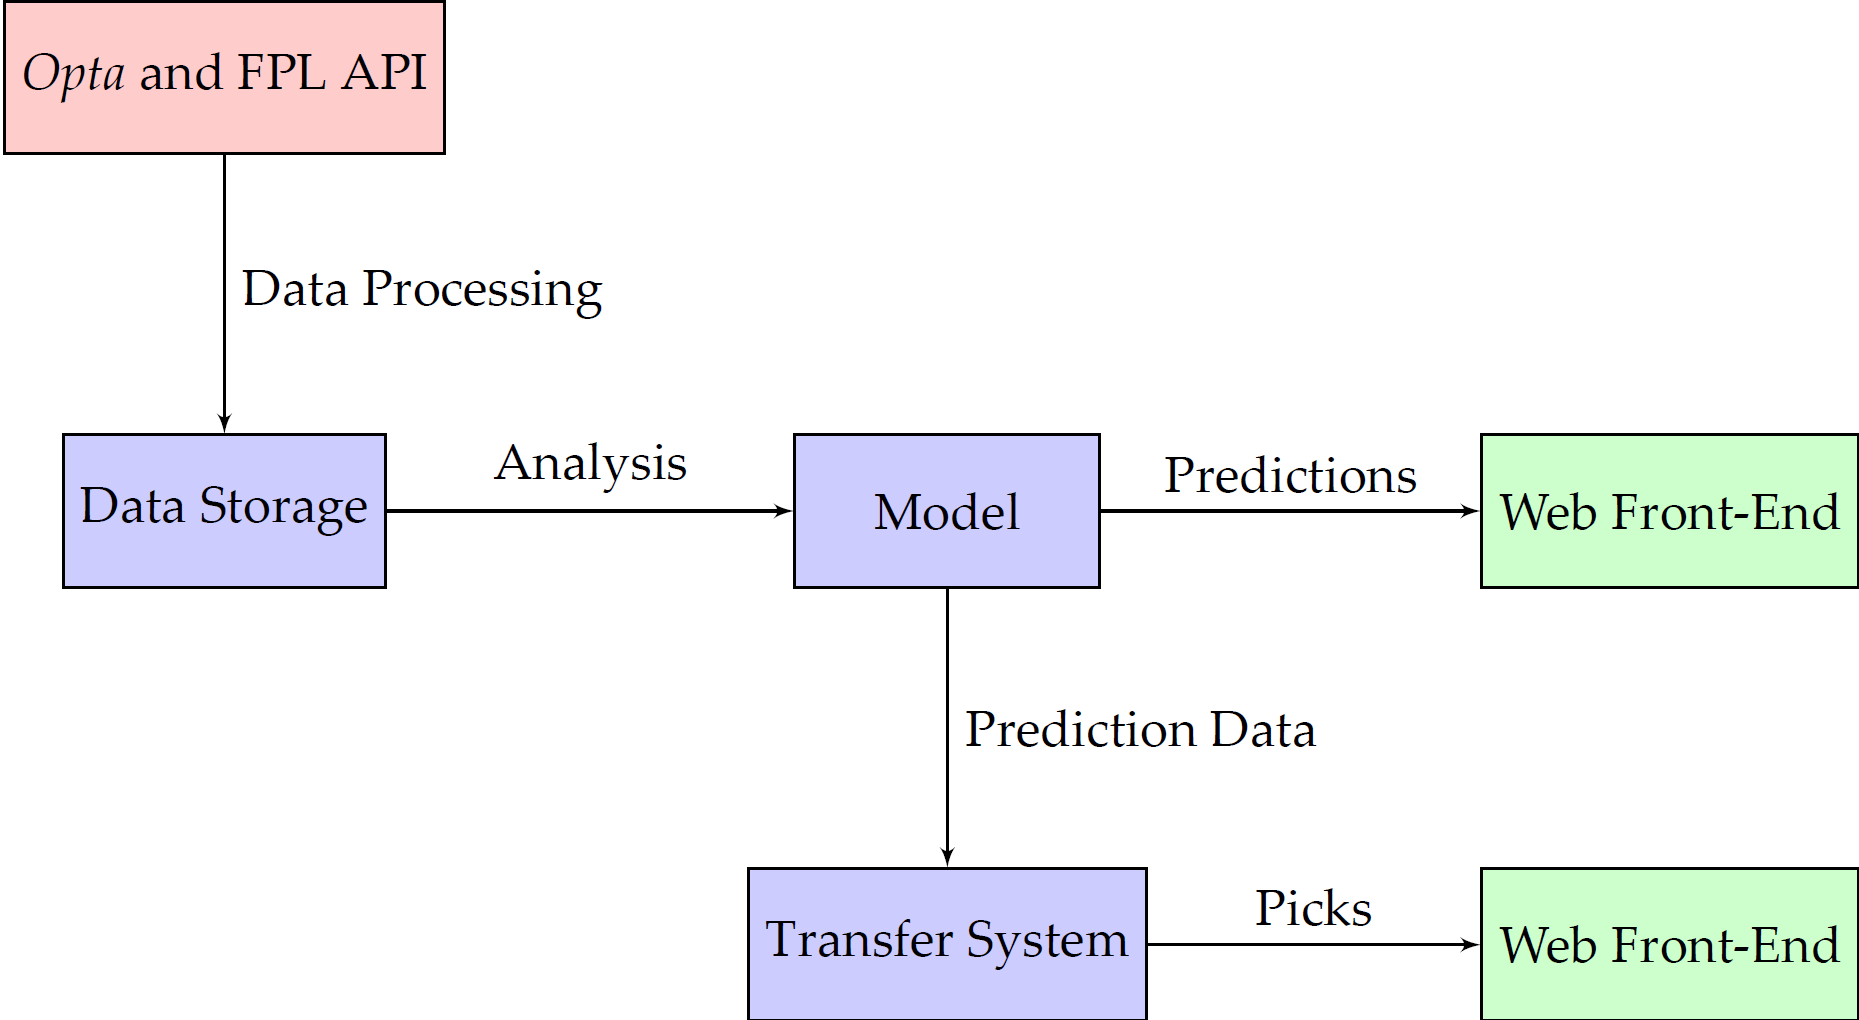
The diagram above shows the whole system in diagrammatic form, taken from my university project final report (as are all of the other images in this post) There are a number of data processing scripts that gather in all the different metrics and information needed for both the model and the transfer system. Once the data has been gathered and stored (which happens after each set of games), it can be used by the model to formulate predictions about the performance of a player in future matches. After the model has updated its predictions for the future, taking into account the newly received data, it can start providing updated results to queries made against the front end (whether that be through the web interface or through the command line API). The transfer system can also use this new data and the new results from the model to provide updated results to queries.
The Model
At the core of the whole prediction system is the model. At a high level, the model is a simple input-output design: it takes a player and information about the Gameweek (For the uninitiated: a Gameweek refers to the period of time covering one round of matches. A team or player can play any number of matches in a Gameweek (including none), but in practice it is rarely more than two.) and returns a JSON object with the player's total points and a breakdown of the score.
The majority of time last year was spent developing and iterating the model. I prioritised in this way because everything else is built on top of the model; it needs to perform well. It appears that this was time well spent - the results from the model testing are generally very positive.
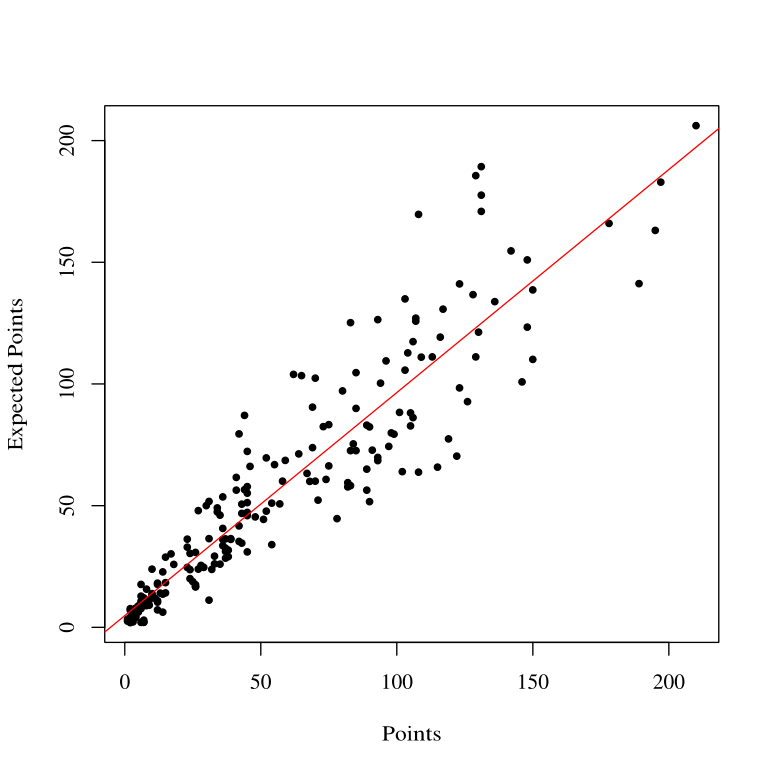
The graph above demonstrates the strength of the model's prediction. For this sample of over 200 players last season, the average difference between the actual points scored in the game by the player and the points predicted by the model is around 0.14 for the entire season. It's also nice to see very high scoring players falling so close to the line of best fit, indicating that players who are scoring large numbers of points in a gameweek (and hence much easier for the model to under-predict) are getting predicted to score a large number of points. The standard deviation of this set of players is fairly high, at 18.44. However, when we normalise the distribution by divining through by the mean, we see that the standard deviation falls to a much more impressive 0.327. Very promising!
The Transfer Selection System
The model may be the core of the project, but almost as important and just as interesting is the transfer selection system. Thus far, it has almost acted as a showcase, demonstrating what kind of tools can be built when one has access to the rich data set and analytic power of the model.
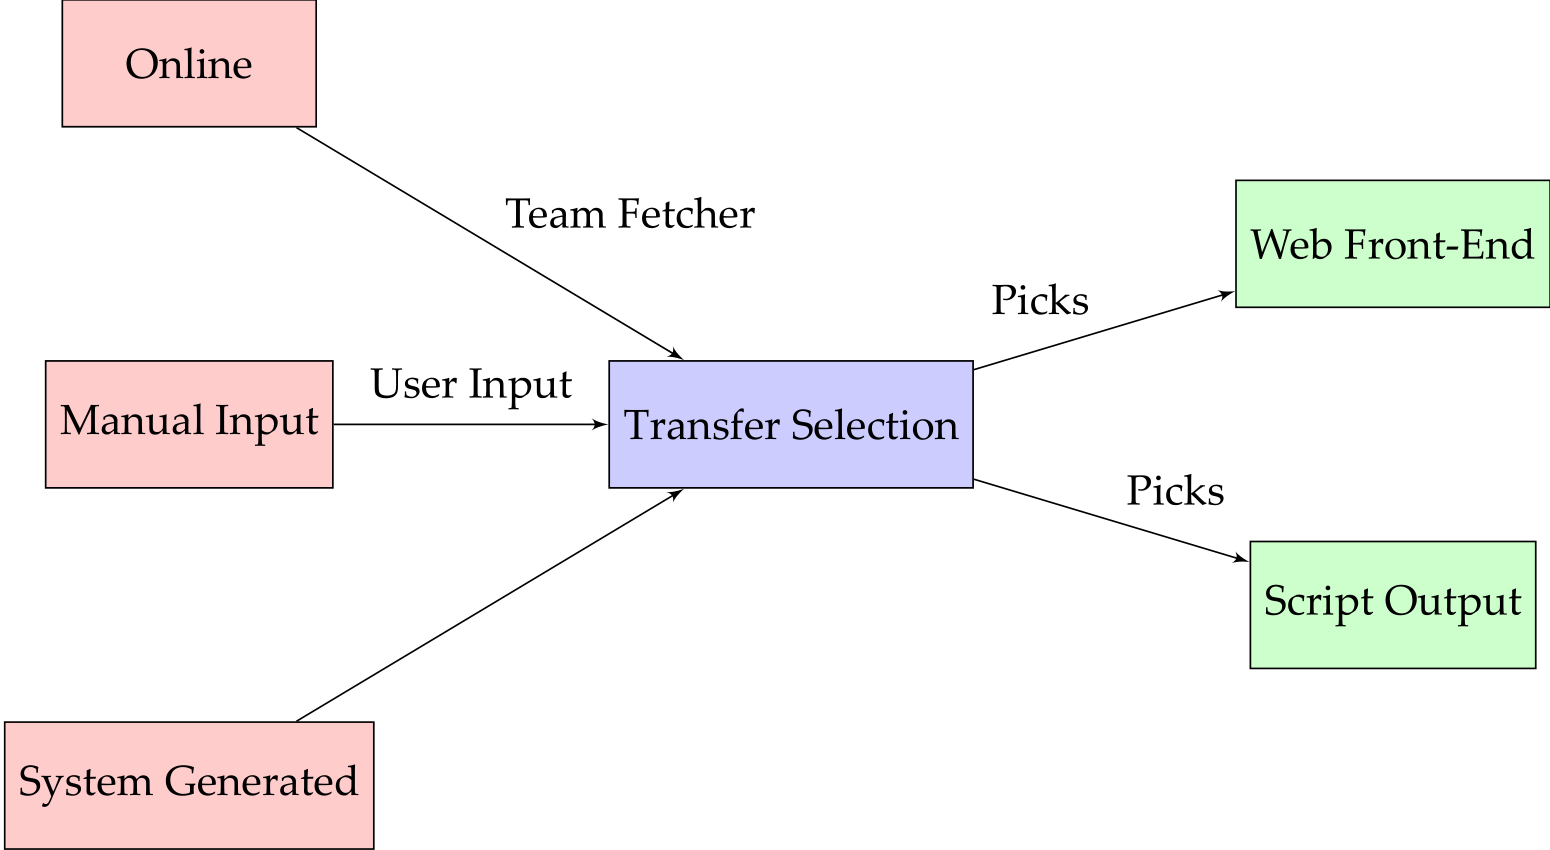
The transfer selection system requires a team as an input. This team can be either fetched from the Fantasy Premier League website, inputted manually through a command line interface or generated by the system. Once the transfer selection system has a team, it processes the team based on a number of different parameters, and returns the new state of the team, with various other details as well as the list of transfers made. This information can be viewed either as output from as script, or over a web interface.
The headline result from the testing of the transfer system makes for decent reading: the best test (The tests work by allowing the system to pick an initial team of players, and then running through a whole season of transfers, recording the predicted and actual scores of the selected team for each gameweek. These tests are run with two related parameters: the first being the number of weeks lookahead that we want to use when making our transfer choices, and the number of segments that our season has to be divided into to make this lookahead feasible.) resulted in an average weekly score of just below 56 points. This is a fairly impressive result, putting the system somewhere between the 12th and 14th percentile in the world, but clearly there's room for improvement.
So that covers the headlines from the work done in the last few months. In the next few days I'll put up a post about the actual improvements I want to make to the system over the course of the next season, and then start posting somewhat shorter (probably) posts updating my progress.
Tags: fantasy football system design overview